Earlier this month Chris and I got to spend time with a graduate-level marketing class at the University of Washington. It was a fun group, and the goal was simple: give them an honest look at what day-to-day marketing actually feels like inside a GTM agency like Trelliswork, and where the work seems to be heading. We talked through how much has shifted, and we kept circling back to one idea that matters more now than at any point in our careers: the way you learn marketing has to change too.
Here is what we walked through.
Marketing has changed
The fundamentals still hold. Know your audience, tell a clear story, earn attention. But the surface area of the job is bigger now. A marketer touches data pipelines, automation, AI tools, and code on a normal Tuesday. The role looks less like a campaign planner and more like a combination of builder and air traffic controller, making the thing and directing everything moving around it.
It's more technical than ever
You no longer hand off the technical work and wait. The people producing the best output are the ones who can open a terminal, wire up a tool, and ship the thing themselves. Comfort with technical work is becoming the difference between a good marketer and a stuck one.
You have to jump in headfirst
You don't learn this from a syllabus. You learn it by staying curious, trying new tools and approaches before you feel ready, and looking for better ways to work along the way. The students who get ahead will be the ones who stop waiting for permission and start experimenting.
Everyone is relearning
Everyone is learning the new tools at the same time, so on the technical side the gap between a student and a veteran is smaller than it has ever been. But experience matters more than ever. Judgment, taste, and knowing what good looks like are valued above anything else, because the tools change but the ability to point them at the right problem does not. That is the opportunity: pair fast learning with real judgment and you become hard to replace.
Think in code
Code is becoming the medium for now, not just the back end. I say for now because coding may not stay as important as it is today. But in this moment, code gives you more control over the models than any other interface. When you can describe what you want and build it directly, you skip the handoffs, the misread mockups, and the version sprawl. It also lets you get to discrete points in the creative process, returning to any version or branching from it instead of working off one file that keeps changing under you. You stop decorating slides and start shipping work.
The tools have all changed
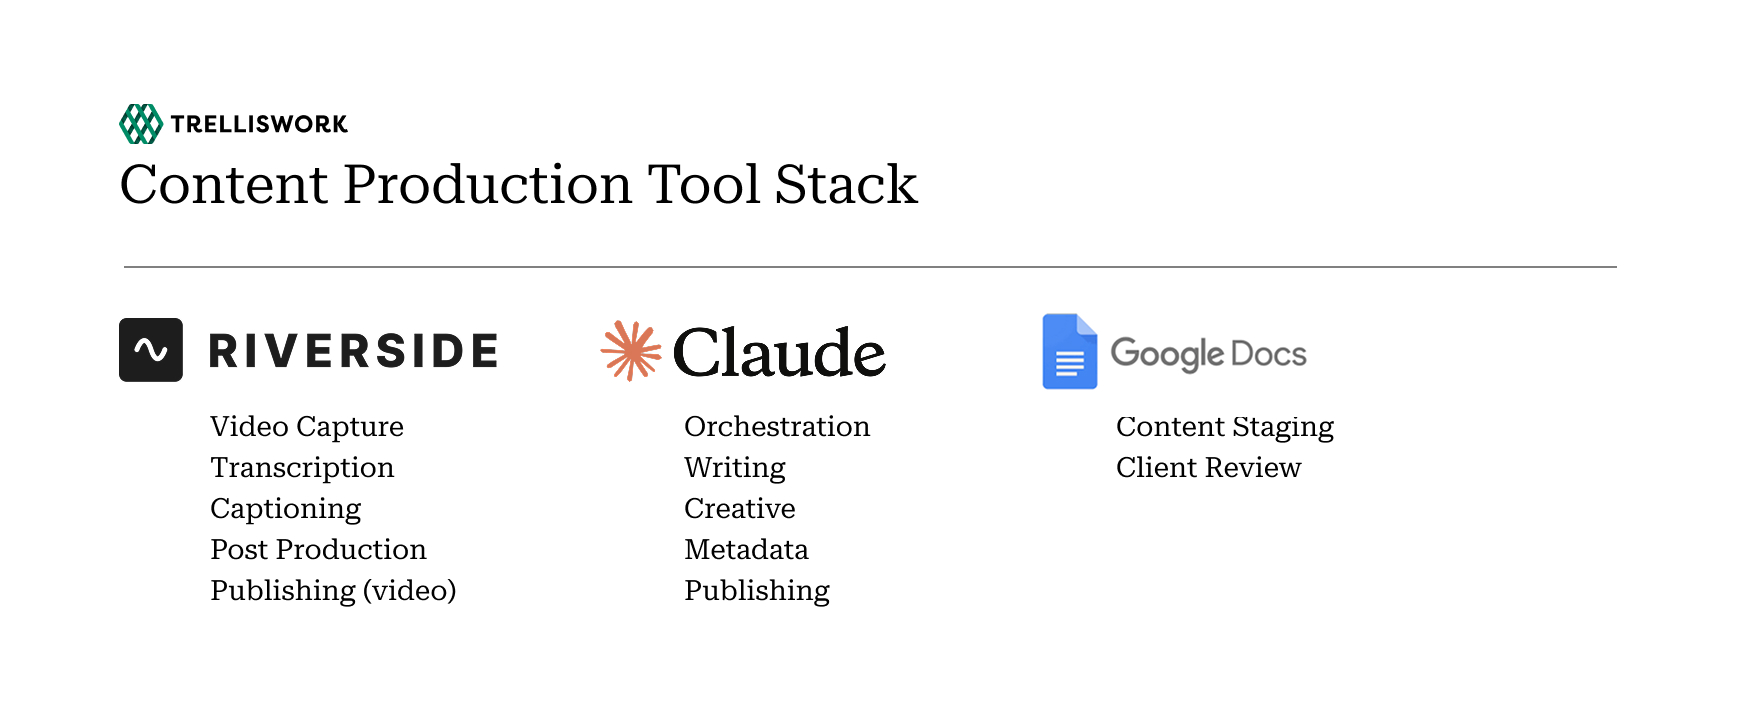
The stack you learn on today will not be the stack you used a few years ago, because most of it did not exist yet. Claude, RB2B, Granola, Clay, Gemini, Riverside. These tools enable more than 80% of the work we deliver for clients, and none of them existed five years ago. Learning a fixed set of tools is no longer the goal. Learning how to pick up new ones fast is. We evaluate new tools on an almost daily basis. The only real choice is to keep adapting and evolving. And to be fair, it is exhausting trying to keep up.
What this looks like in practice
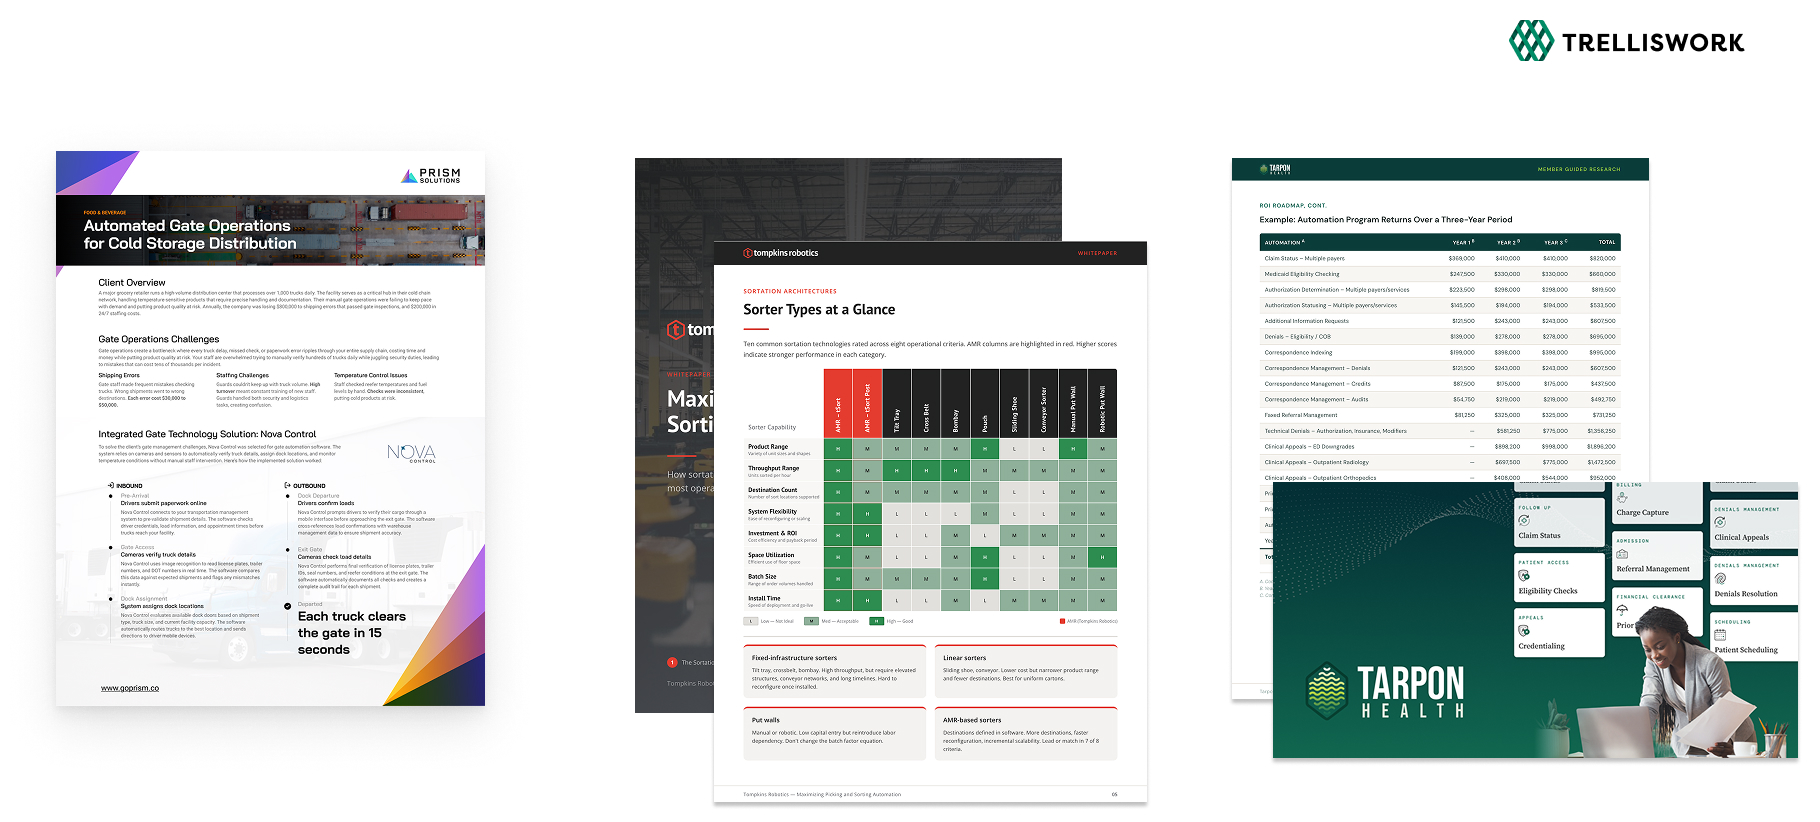
To make it concrete, we showed the class three whitepapers we built for three different clients. Every one was created and published entirely in code, from a terminal. No design tool, no page editor, no dragging pixels around a canvas.
The point was not that the work built itself. It was that we got to rethink the whole process. When the document lives in code, a round of feedback is a change in the source, not a manual rebuild. A revision that used to mean a designer, an export, and a reformat became a single pass. So the cycle time went from days or weeks to minutes.
That is the shift. Not a faster version of the old process, but a different process altogether.
The takeaway
Marketing rewards people who build. If you are early in your career, that is good news. The tools are new enough that effort and curiosity can outpace tenure, but the point is not to beat experience. It is to gain it faster. Curiosity is the bridge. It lets you take on real work sooner, see more reps, and build judgment years ahead of schedule, and experience will always be what matters. Open the terminal, make something, learn from it, and do it again.
.jpg)