
.png)
"What's a good open rate?"
This comes up all the time. It’s the first metric with any data for an outbound email campaign, so naturally we get questions. Sometimes it's phrased as "what open rate should we target?" or "why are our opens so low?" But the more important question to start with is: what does this number actually mean?
Think of open rate as a utility metric. It tells you when something's wrong. It helps identify what's working when you get positive replies. But trying to optimize open rates on their own will send you down rabbit holes that make you no smarter.
Open rates don't correlate with business outcomes. They don't tell you if people read your emails. They don't predict who will reply or book meetings. And with Apple's Mail Privacy Protection now affecting 45% of recipients, the number you see in your dashboard increasingly measures nothing at all.
This article explains how open tracking actually works, why privacy changes broke it, and what you should measure instead.
Estimated read time: 10 minutes
How Email Open Tracking Actually Works
Open tracking relies on a simple trick: your email platform embeds a tiny invisible image (a 1×1 pixel) into every email you send. When someone opens the email and their mail client loads images, it makes an HTTP GET request to fetch that tracking pixel from your server. Your platform sees the request and logs an "open."
That's it. An open just means the tracking pixel loaded.
Here's the technical reality of what counts as an open:
- The recipient's email client requests the tracking pixel
- Their device has images enabled (not blocked)
- The HTTP request completes successfully
- Your email platform receives and logs the request
This system has always been flawed. Plain text emails can't track opens because they contain no images. Preview panes can trigger opens without the recipient actually reading anything. Corporate firewalls and email clients block images by default. And size limits on images can prevent tracking pixels from loading even when images are enabled.
But recent changes made these existing problems catastrophic.
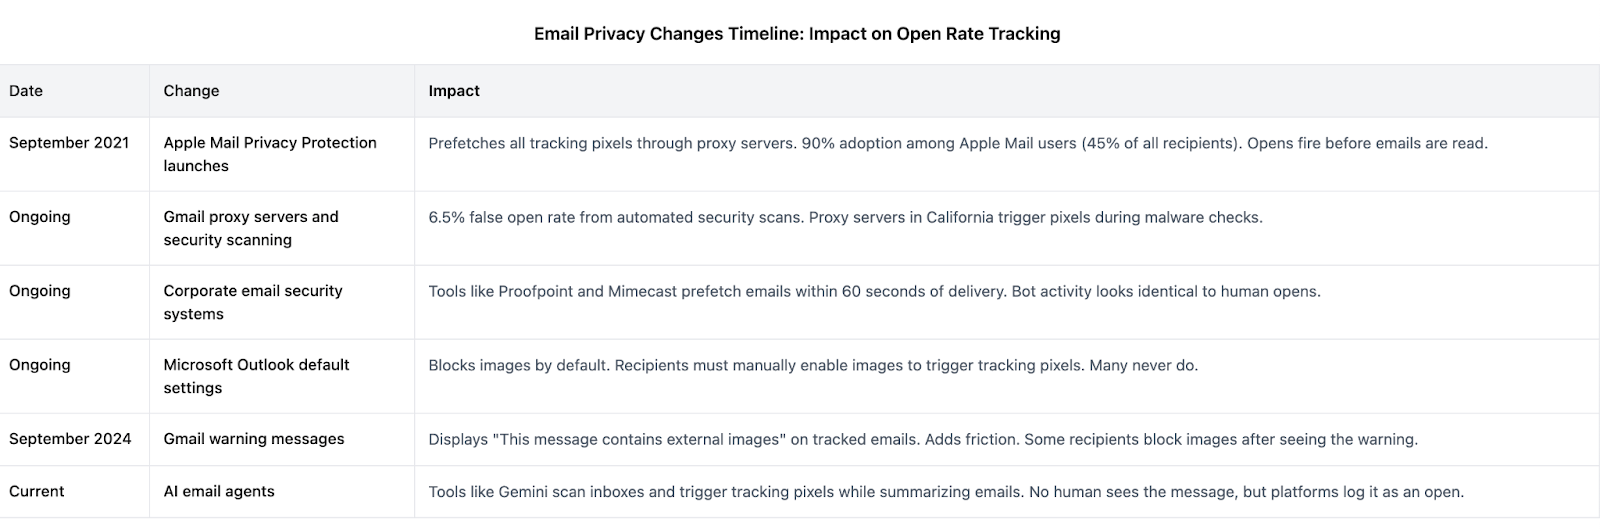
What Broke: Privacy Changes That Killed Open Rate Reliability
Apple Mail Privacy Protection
In September 2021, Apple launched Mail Privacy Protection (MPP). It changed everything.
MPP works by prefetching all tracking pixels through Apple's proxy servers before you even open an email. Your email platform sees the proxy server request and logs an open. But you haven't opened anything yet. The email might sit unread in your inbox for days, but the "open" is already fired.
Current data shows 90% adoption among Apple Mail users. Apple Mail represents roughly 45% of all email recipients. That means nearly half of your "opens" might be proxy preferences that have nothing to do with human behavior.
The timing patterns reveal the problem. Before MPP, you'd see opens cluster during business hours. Now you see opens fire at 3 AM because Apple's servers prefetch overnight. You can't distinguish proxy opens from real opens in your dashboard. They look identical.
Gmail Proxy Servers and Security Scanning
Gmail runs security scans on incoming emails through California-based proxy servers. These scans trigger tracking pixels to check for malicious links. Research shows a 6.5% false open rate from Gmail's scanning alone.
Corporate email security systems add another layer of noise. Tools like Proofpoint and Mimecast prefetch emails to scan for malware. These security bots generate opens within 60 seconds of email delivery. They're protecting networks, but they're also inflating your open rates with bot activity that looks exactly like human opens.
Microsoft Outlook blocks images by default. Recipients have to manually enable images to load tracking pixels. Many never do.
What about AI Email Agents?
AI agents reading your emails trigger the same tracking pixels as human opens. When tools like Gemini scan your inbox to generate daily summaries, they load email content and request tracking pixels. Your email platform logs these as opens even though no human saw the message.
This breaks email metrics in a fundamental way: the open rate inflates while actual human attention is zero. As AI agents become standard features in Gmail, Outlook, and third-party inbox tools, they create automated, constant bot activity that makes open rates nearly meaningless. The metric looks identical to human behavior in your dashboard, but it measures machine processing instead of genuine engagement.
September 2024: Gmail's Warning Messages
In September 2024, Gmail started displaying warning messages on tracked emails: "This message contains external images." Recipients now see explicit notice when you're tracking them. Some click through anyway. Some don't. But the friction increased.
Current Benchmarks (And Why They Don't Matter)
Based on what we've seen running campaigns and analyzing industry data, the latest B2B cold email open rates range from 25% to 45%. SaaS and IT businesses tend to fall on the lowest end of that spectrum, hovering around 24-26%. Meanwhile, industries like energy management and oil and gas services consistently see rates on the higher end, closer to 42-43%. The spread is significant and largely driven by how familiar recipients are with cold outreach in their specific industry.
The consensus is that: a 15-25% open rate is now considered "acceptable" for cold B2B campaigns, while anything above 40% is excellent. But here's the uncomfortable truth: these numbers increasingly measure nothing meaningful.
Unfortunately, these benchmarks are becoming meaningless. Based on industry data, our framework shows that a 60% open rate merely indicates that 60% of tracking pixels have loaded. It provides no information about whether 60% of recipients actually read the email, engaged with the message, or are interested in the offer.
You're comparing yourself to industry averages that are equally broken.
Utility vs Vanity: How to Actually Use Open Rates
Chad S. White, author of "Email Marketing Rules" and Head of Research at Zeta Global, makes the distinction clear: open rates are health metrics, not success metrics.
Open rates CAN tell you:
1. Deliverability health signals If your open rate suddenly drops from 35% to 15%, you have a delivery problem. Check your bounce rate, review your sender reputation, and audit your email list quality. Low opens combined with normal click rates suggest deliverability issues.
2. Subject line comparative testing (within your own baseline) Run A/B tests where you change only the subject line. Compare open rates for version A vs version B sent to similar audiences at similar times. The relative difference tells you which subject line performs better for your specific list. Don't compare your open rates to industry benchmarks. Compare them to your own previous campaigns.
3. Re-engagement triggers If someone hasn't opened your last five emails, they probably aren't reading them. Use opens (or lack of opens) to trigger re-engagement sequences or list cleaning. This works because consistent non-opens signal disengagement even if individual opens are unreliable.
Open rates CANNOT tell you:
1. Actual reading behavior An open means the pixel loaded. It says nothing about whether the recipient read your email, scanned it, or immediately deleted it.
2. Conversion intent High opens don't predict replies, clicks, or conversions. People who open emails and never respond are functionally identical to people who never opened at all.
3. Campaign ROI Revenue comes from actions (replies, meetings booked, deals closed), not from tracking pixel loading.
4. Genuine engagement Prefetched opens, security scans, and bot activity all count as opens. Your dashboard can't distinguish human engagement from automated system behavior.
Warning signs your opens are meaningless:
- Sudden spikes in open rates (likely MPP adoption in your list)
- 100% open rates (definitely bots or security scanners)
- Opens at 3 AM or other off-hours (proxy prefetching)
- Opens within 60 seconds of send (security scanning)
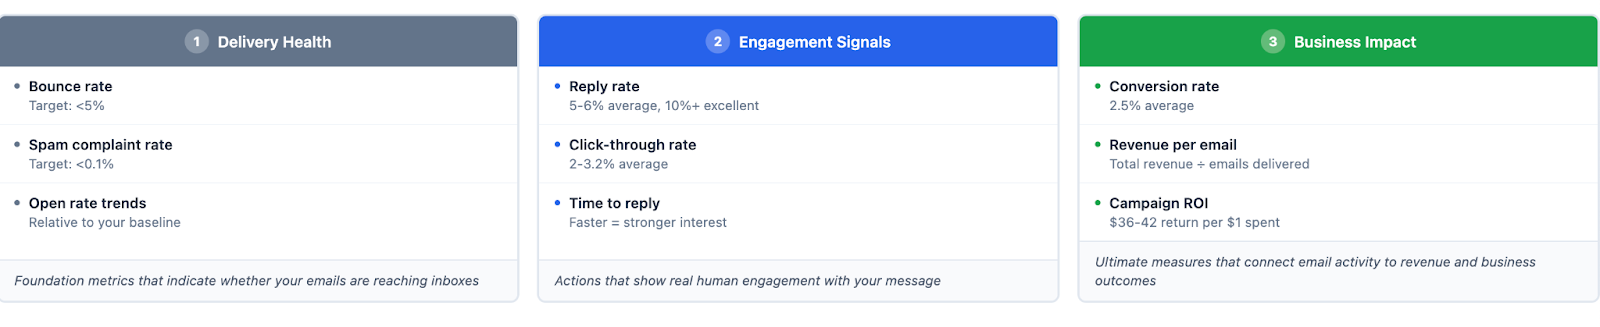
What to Measure Instead: Metrics That Predict Business Outcomes
Reply Rates
Average B2B cold email reply rates sit around 5-6%. Anything above 10% is excellent. Reply rates are unaffected by MPP and proxy servers because they measure actual human action.
Track total replies (positive and negative). If someone replies "not interested," that's still engagement. It tells you your email reached a real person who read enough to respond. Low reply rates with high opens suggest your message doesn't resonate.
Click-Through Rates
Average B2B click-through rates range from 2% to 3.2%. Clicks are concrete actions that require human decision making. They're immune to privacy protections because no one is prefetching your links.
High click-through rates with low reply rates might mean your links are compelling but your call to action is unclear. High opens with low clicks suggest your subject line works but your email content doesn't deliver.
Conversion Rates
Average B2B email conversion rate is 2.5%. Conversion means the recipient took your desired action: booked a meeting, downloaded a resource, started a trial, or requested information.
Conversion rates connect directly to pipeline and revenue. A campaign with 50% opens and 0.5% conversion rate is worse than a campaign with 20% opens and 3% conversion rate.
Revenue Per Email
Calculate total revenue divided by total emails delivered. This metric cuts through all the noise. It doesn't matter if opens are inflated or clicks are low if the campaign generates $50,000 in closed deals from 1,000 emails sent.
Revenue per email lets you compare channels. If outbound email generates $25 per email and paid ads generate $15 per click, you know where to allocate budget.
Email Marketing ROI
Industry averages show $36 to $42 return for every $1 spent on email marketing. Track your actual ROI using (revenue from campaign minus campaign costs) divided by campaign costs.
ROI accounts for everything: list acquisition, tool costs, time investment, and creative development. A campaign with terrible open rates but strong ROI should scale. A campaign with amazing open rates but negative ROI should stop.
Three-tier measurement framework table:
Operational Problems Open Rates Create
The obsession with open rates causes real damage to B2B email programs:
List hygiene strategies removing engaged readers Marketing teams build automation that removes "unengaged" contacts based on open rate thresholds. But many of those contacts have images disabled. They're reading every email and planning to reply when the timing is right. You're removing them from your list because your tracking pixel can't load.
A/B tests declaring false winners You test two subject lines. Version A gets 42% opens. Version B gets 35% opens. You declare A the winner and scale it. But version B actually drove more replies and conversions. You optimized for a vanity metric that doesn't correlate with business outcomes.
Automation triggers firing incorrectly You built a workflow that sends a follow-up sequence when someone opens but doesn't click. Except half those "opens" are Apple prefetches that happened before the recipient woke up. Your automation spams people based on bot activity.
Inability to determine actual read time You want to know if recipients read your 500-word email or bounced after the first line. Open tracking can't tell you. MPP prefetches everything immediately. You have no signal about actual engagement depth.
Bifurcated data that makes analysis impossible Your campaign shows 60% opens from Apple Mail users and 15% opens from Outlook users. Is your message resonating better with one group? Or is it just that one blocks images by default? You can't tell. The data is meaningless for comparison.
Executive reporting built on broken metrics Your CEO wants to know campaign performance. You show a dashboard with open rates as the primary metric. The number is up 15% quarter over quarter. Everyone celebrates. But reply rates are flat and pipeline is down. You optimized and reported on the wrong thing.
Tactical Optimizations That Still Work
Not everything is broken. Some optimizations improve actual engagement:
Time Commitment in Subject Lines
Subject lines with explicit time commitments ("2 minute overview" or "Quick question") increase opens by 28%. This works because it sets expectations and reduces perceived effort.
Send Timing
Thursday and Tuesday mornings between 9 AM and 11 AM show 44% open rates compared to 30% on weekends. Business hours in the recipient's timezone matter. Avoid top-of-hour sends when 80%+ of all emails go out.
Job Title Segmentation
Tailoring messages to specific job titles and seniority levels improves reply rates by 38%. This isn't about open rates. It's about relevance. When your message speaks directly to a VP of Sales's pain points, they reply.
Tracking Pixel Removal
Some teams test sending emails without tracking pixels. They report 3% higher response rates. Recipients notice when you're not tracking them. Removing the pixel (and the Gmail warning message) builds trust.
But here's the insight: none of these optimizations require open rates to measure success. You validate them by tracking reply rates, conversions, and pipeline impact.
What to Do Starting Monday
Stop obsessing over open rates. Start tracking metrics that correlate with revenue.
Immediate actions:
- Add reply rate tracking to your dashboard. Make it the primary metric you review daily. Target 5-6% for cold outreach. Anything above 10% is excellent.
- Calculate your revenue per email for current campaigns. Divide total revenue by emails delivered. Compare across campaigns and channels.
- Review your list hygiene rules. If you're removing contacts based on open rates alone, you're probably removing engaged readers who have images disabled. Add reply rate and click rate as qualifying signals.
- Audit your A/B testing methodology. Declare winners based on reply rates or conversion rates, not opens. Run tests for at least 100 sends per variant to reach statistical significance.
- Fix deliverability if open rates dropped suddenly. A sharp drop (35% to 15% in one week) signals delivery problems. Check your bounce rate, sender reputation, and email authentication (SPF, DKIM, DMARC).
- Segment reporting by email client. View Apple Mail opens separately from Gmail and Outlook. This won't fix the underlying problem, but it helps you understand how much proxy activity affects your data.
Open rates aren't useless. They're just not what you think they are. Treat them as diagnostic signals, not success indicators. Focus on the metrics that predict pipeline, revenue, and business growth.


